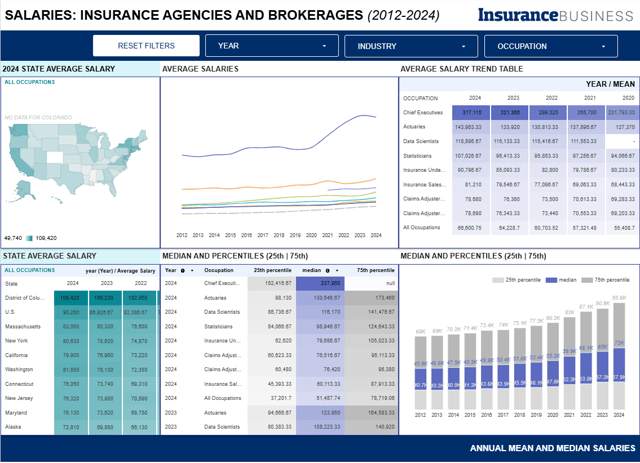
This dashboard gives a clear view of salary trends for key roles in insurance agencies and brokerages across the US
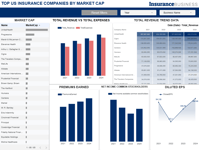
In Earnings Per Share, since 2021 The Hartford grew 7x and Allstate tripled. Centene more than doubled, with positive EPS growth unique among top health providers
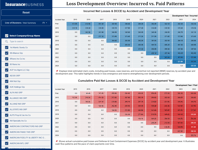
This dashboard offers a comprehensive and structured analysis of insurer reserve development patterns, paid losses, and reserve adequacy based on the Annual Statement Year 2024. It is designed to support informed decision-making across underwriting, product strategy, financial planning, claims management, and regulatory compliance
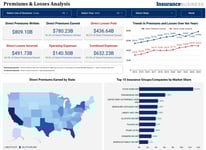
The Property and Casualty Financial Insights Dashboard provides a comprehensive view of financial performance across business lines. Users can analyze key metrics, including premium written, premium earned, losses, expenses, market share and financial ratios. Interactive filters by line of business (LOB), year and state allow for trend analysis, market comparisons and pattern identification
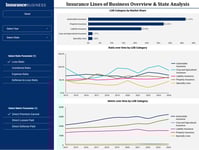
The Property and Casualty LOB Performance and Market Trends Dashboard provides a comprehensive comparison of LOB categories and subcategories, enabling users to analyze key financial ratios, market share, premium trends, losses, and defense expense structures. With filtering options and a dedicated subcategory analysis page, this dashboard supports data-driven decision-making for industry professionals seeking insights into market dynamics

As reliance on wholesale brokers and managing general agents (MGAs) grows, so do expectations on responsiveness, product knowledge, and the ability to place niche or emerging risks. But the gap between expectations and performance is widening in key areas.

Illinois’s surplus lines market has doubled in a decade to $4.4 billion, with excess carriers gaining share in property, auto liability, and medical malpractice as admitted markets shrink. This data-rich review benchmarks top providers, parses recent legislative shifts, and pinpoints where growth and risk are concentrating in the Prairie State’s surplus lines market.

In Earnings Per Share, since 2021 The Hartford grew 7x and Allstate tripled. Centene more than doubled, with positive EPS growth unique among top health providers

Liability insurance defense costs are significantly higher in states like New York, California, and Washington, but while this spending has begun to decrease nationwide, rising social inflation is driving up losses and increasing pressure on insurers